The following text serves as a temporary placeholder, prior to expert moderation
fPET
Moderated by: TBD
Functional Positron Emission Tomography (fPET) is a non-invasive imaging technique which with the help of radioactive tracers, visualizes the metabolism or blood-flow changes underlying functional neuronal activation (1).
Technical Parameters
PET is based on the detection of radioactivity which is emitted by radioactive tracers injected in the patient’s venous system. These tracers can be attached to various types of metabolically valuable substances, such as oxygen, carbon, nitrogen or gallium. After initial injection, the tracer is given time be taken up in the tissues of interest. Subsequently, the patient is placed in the PET scanner, which detects the rate of metabolisms of the radioactive substance of interest. During their metabolism, the radioactive tracers emit positrons, which interact with electrons in the tissue that ultimately annihilate to create two photons, each 511 keV. This results in two so called gamma rays sent out in opposite directions. These gamma rays are subjected to ‘coincidence detection’ (i.e. simultaneous detection by two opposing detectors), using hundreds of so-called PET-cameras placed in a ring surrounding the patient. The more gamma rays emitted from a certain tissue, the higher the level of activity in that particular tissue and the brighter the tissue will appear on the image (1,2).
In terms of spatial resolution, fPET performs slightly worse than fMRI, but still in the millimeter range (1,2). The spatial resolution is determined partially by the two detectors mentioned previously, which define the line of response along which the original emission took place. In terms of temporal resolution, PET has a poor performance, in the minute-range, limited both by the technique itself as well as the required time needed for the metabolism of the radioactive molecule. The latter can be slightly improved by working with continuous administration of radiotracer, as will be discussed below. A full acquisition can take up to an hour, similar to fMRI.
Biological Substrate
The choice of tracer primarily dictates the aspect of the brain function which is visualized (3), which is always either a hemodynamics or a metabolism-based signal, indicative of neuronal activity through the process of NVC. For example, 18F-2-deoxyglucose (18FDG) is used to investigate cerebral glucose metabolism, whereas H215O is used to examine CBF. Additionally, PET facilitates measurements of blood volume (vascularity), oxygen metabolism, neurotransmitter release and many more (4). The problem with conventional PET for functional imaging is its limited temporal resolution, which complicates measurements of neuronal activity. A potential a solution would be to step away from the single administration of a bolus of radiotracer and providing continuous infusion of for example 18FDG to perform so called ‘dynamic’ PET-scanning. Dynamic PET-scanning enhances sensitivity for tracking dynamic radiotracer uptake. Dynamic PET-scanning is also referred to as fPET (2).
Intra-operative applicability
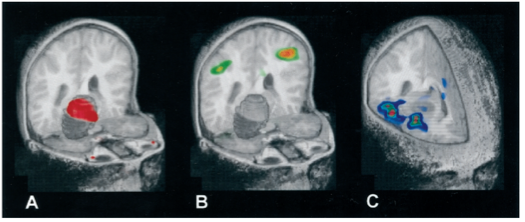
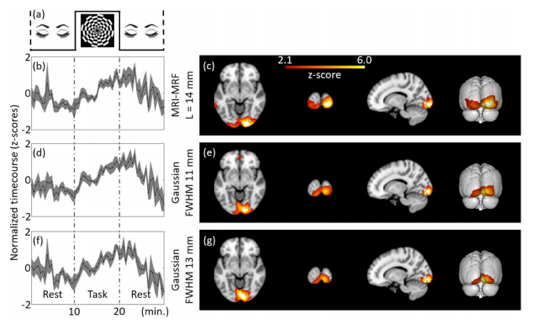
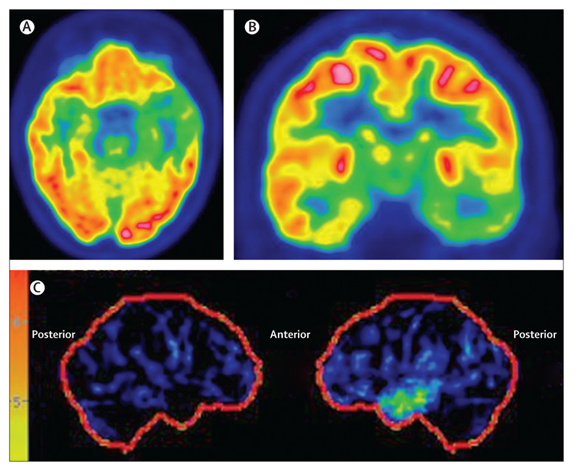
Clinically, PET is often used as a structural imaging technique to localize and characterize neoplasms, at times combined with the structural Computed Tomography (CT)-scan in a single PET/CT-scanner (5). For functional brain mapping applications, literature reports several mostly experimental applications (see Figures 1-3) (6–10), which report successful brain mapping attempts when combined with MRI co-registration, although still significantly limited in spatial but especially temporal resolution. Given its invasive nature (use of radiotracers), fPET is not a preferred tool for pre-operative planning. What is more, the machine is expensive (both in terms of acquisition and maintenance) as well as nonn-mobile, allowing only for pre-operative surgical planning using MRI or CT co-registration (Figures 1-3).
References
- Berger A. Positron emission tomography. British Medical Journal. 2003.
- Li S, Jamadar SD, Ward PGD, Premaratne M, Egan GF, Chen Z. Analysis of continuous infusion functional PET (fPET) in the human brain. Neuroimage. 2020;
- Tai YF, Piccini P. Applications of positron emission tomography (PET) in neurology. Journal of Neurology, Neurosurgery and Psychiatry. 2004.
- Lammertsma AA. PET/SPECT: Functional imaging beyond flow. In: Vision Research. 2001.
- Chen W. Clinical applications of PET in brain tumors. Journal of Nuclear Medicine. 2007.
- Bittar RG, Olivier A, Sadikot AF, Andermann F, Comeau RM, Cyr M, et al. Localization of somatosensory function by using positron emission tomography scanning: A comparison with intraoperative cortical stimulation. J Neurosurg. 1999;90(3):478–83.
- Kaplan AM, Bandy DJ, Manwaring KH, Chen K. Functional brain mapping using positron emission tomography scanning in preoperative neurosurgical planning for pediatric brain tumors.Neurosurg. 1999;
- Leblanc R, Meyer E, Bub D, Zatorre RJ, Evans AC. Language localization with activation positron emission tomography scanning. Neurosurgery. 1992;
- Fried I, Nenov VI, Ojemann SG, Woods RP. Functional MR and PET imaging of rolandic and visual cortices for neurosurgical planning. J Neurosurg. 1995;
- Fox PT, Mintun MA. Noninvasive functional brain mapping by change-distribution analysis of averaged PET images of H215O tissue activity. J Nucl Med. 1989;
- Sudarshan VP, Li S, Jamadar SD, Egan GF, Awate SP, Chen Z. Improved temporal resolution for mapping brain metabolism using functional PET and anatomical MRI knowledge. bioRxiv. 2020;
- Duncan JS, Winston GP, Koepp MJ, Ourselin S. Brain imaging in the assessment for epilepsy surgery. The Lancet Neurology. 2016.