VSD/GEVI-i
Moderated by Dr. Aleksandra Badura, Associate Professor Department of Neuroscience, Erasmus MC, Rotterdam, The Netherlands
Voltage Sensitive Dye imaging (VSD-i) or Genetically Encodable Voltage Indicator imaging (GEVI-i) are optical imaging techniques which rely on capturing the changes in absorption or emission spectra of artificial dyes or fluorescent proteins corresponding to changes in the membrane potential. As such, VSD/GEVI-i serve as a measure of changes in action potentials and therefore neuronal activity.
Technical Parameters
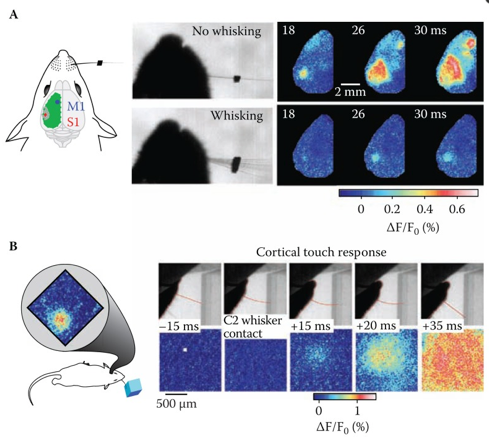
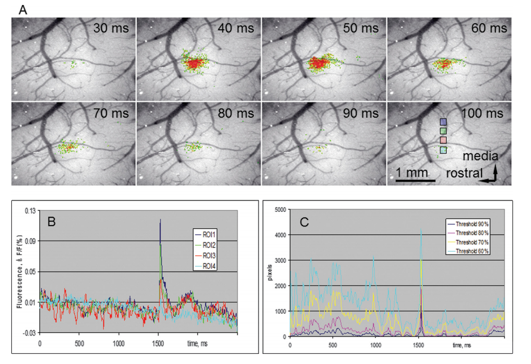
In VSD/GEVI-i dyes or proteins are used which change in absorption or emission spectra depending upon changes in membrane potential, and as such act as a direct indicator of electrical neuronal activity (1–4). VSD/GEVI-i requires a fluorescence microscope and camera, the latter of which mainly dictates the temporal resolution (msec), spatial resolution (<50 µm) and field of view that can be achieved (in the range of a neuronal populations) (Figure 1 and 2) (2,5). Like most other optical imaging techniques, the penetration depth of VSD/GEVI-i is very limited (<500 µm). Additionally, the dyes themselves co-determine the sensitivity with which activity can be visualized, with the size of the optical signals being dependent on the change in size of the action potential. Several groups are working on next-generation VSDs or GEVIs with stronger membrane binding qualities, or higher voltage-sensitivities, to further enhance spatial resolution during imaging (4,6).
Biological Substrate
VSD/GEVI-i involves optical recordings of changes in fluorescence due to voltage changes in neuronal membranes (1-4). These voltage changes are an integral component of the action potential which a neuron generates in cases of functional activation (5). Interestingly, unlike other electrical-based techniques, VSD/GEVI-i is able to detect subthreshold synaptic potentials in addition to spiking activity, and that for a larger population of neurons at once (7). VSD/GEVI-i attempts to visualize an integral component of electrical neuronal activity and relies on measurement of light intensity and the membrane potential based on an an assumed – often linear – relationship between the two (4,8). Often, VSD/GEVI-i data is presented as a fractional intensity change over time, which can be translated to color-maps overlaying the tissue (Figure 1 and 2).
Intra-operative applicability
VSD/GEVI-i so far seems limited to fundamental, neuroscientific applications only. The underlying reason for this lag in clinical maturity could be attributed to various limiting factors: first and foremost, VSD/GEVI-i requires the presence of dyes or GEVIs in the tissue, which can be considered as an additional invasive step compared to techniques exploiting the tissue’s endogenous contrast. Another major issue with VSDs/GEVIs is the actual signal-to-noise ratio (SNR), requiring significant averaging to find functional signal (which means longer duration of acquisition), with a technique which is already susceptible to bleaching. Also, like many other microscopy-based techniques, interference of motion is a significant challenge, which will only become larger in the intra-operative context. What should not be limiting, however, is the use of fluorescence microscopes in an intra-operative setting. Fluorescent dyes targeted to the molecular differences between tumor and healthy tissue are being used intra-operatively to help identify structural tumor borders (9).
References
- Tsytsarev V, Liao L De, Kong KV, Liu YH, Erzurumlu RS, Olivo M, et al. Recent progress in voltage-sensitive dye imaging for neuroscience. Journal of Nanoscience and Nanotechnology. 2014.
- Ferezou I, Matyas F, Petersen CCH. Imaging the Brain in Action: Real-Time Voltage- Sensitive Dye Imaging of Sensorimotor Cortex of Awake Behaving Mice. In Vivo Optical Imaging of Brain Function. 2009.
- Dyes V, Cinelli AR. High-Definition Mapping of Neural Activity Using. Online. 2000;
- Xu Y, Zou P, Cohen AE. Voltage imaging with genetically encoded indicators. Curr Opin Chem Biol. 2017;39.
- Carlson GC, Coulter DA. In vitro functional imaging in brain slices using fast voltage-sensitive dye imaging combined with whole-cell patch recording. Nat Protoc. 2008;
- Fromherz P, Hübener G, Kuhn B, Hinner MJ. ANNINE-6plus, a voltage-sensitive dye with good solubility, strong membrane binding and high sensitivity. Eur Biophys J. 2008;
- Carter M, Shieh JC. Visualizing Nervous System Function. In: Guide to Research Techniques in Neuroscience. 2010.
- ANTIĆ S, ZEČEVIĆ D. Imaging Membrane Potential Changes in Individual Neurons. In: Fluorescent and Luminescent Probes for Biological Activity. 1999.
- Zhang DY, Singhal S, Lee JYK. Optical Principles of Fluorescence-Guided Brain Tumor Surgery: A Practical Primer for the Neurosurgeon. Clin Neurosurg. 2019;85(3):312–24.